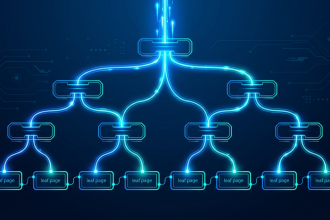


When your website takes half a second, it is almost never the fault of a single server. It is the sum of twenty microservices passing the request along like a relay baton, each adding its own milliseconds. The problem is that if one of them is slow, nobody knows which one. That is what distributed tracing is for: the technique that reconstructs the complete journey of a request through every service it touches.
The problem: a system you cannot see
In a microservices architecture, a single browser request can trigger dozens of internal calls: the gateway calls the authentication service, which queries the database, then calls the payments service, which in turn calls another one. Every hop adds latency, and latency accumulates. If the user perceives 500 ms, how much of that is network, how much is CPU, how much is a saturated queue? With the traditional per-service logs, it is impossible to know: each log is a piece of a puzzle without the reference image.
The core idea: traces and spans
Distributed tracing introduces two key concepts. A trace is the complete journey of a request, identified by a single trace ID (a unique identifier, usually a 128-bit number). Within that trace, each individual operation —an HTTP call, a SQL query, a computation— is a span: a unit of work with its own name, start time and duration.
Spans are organized in a hierarchy. The root span is the original request; each internal call creates a child span. This forms a tree that represents exactly what happened, in what order, and how long each step took. It is like a Gantt chart of your request: at a glance you can see which span is the bottleneck.
How context travels between services
The trickiest part is that the trace ID must survive the hops between services. When service A calls B over HTTP, it is not enough for A to know its own trace ID: B must receive it so it can record its spans under the same trace. This is done through context propagation: the trace ID and the parent span are transmitted in the HTTP headers of each call.
The de facto standard is the traceparent header defined by the W3C Trace Context. Its format is very compact: 00-<32-hex trace-id>-<16-hex span-id>-<flags>. Each service that receives this header creates its own span, attaches it to the indicated parent span, and when it calls another service it generates a new span ID and writes it into the outgoing header. This way the context travels from service to service without being lost.
Sampling: you cannot store everything
Recording every span of every request would produce an unmanageable amount of data. A system with thousands of requests per second would generate gigabytes of spans per minute. That is why sampling is used: only a fraction of traces is recorded, for example 1% or 10%. The decision can be deterministic (based on the trace ID, so all services of the same trace agree) or rule-based, such as sampling 100% of requests that exceed a latency threshold. Head-based sampling guarantees that if a trace is sampled, all its spans are stored, even if they pass through different services.
From spans to answers: the storage backend
Spans end up in a specialized backend that indexes them by trace ID. Tools such as Jaeger, Zipkin or Tempo store spans in databases optimized for lookups by ID and time, and offer an interface to visualize the span tree of any trace. The open standard OpenTelemetry unifies span generation across languages and protocols, so you are not locked into a specific vendor: you generate telemetry once and send it to any compatible backend.
Why it matters more than it seems
Distributed tracing is not only for diagnosing slowness. It is the tool that reveals problems logs cannot show: a call that fails silently and is retried, a dependency that degrades only under load, or a service that burns CPU without its latency giving it away. In distributed systems, where failure is the norm rather than the exception, being able to reconstruct the exact journey of every request is the difference between fixing a problem in minutes or hunting for it for hours.